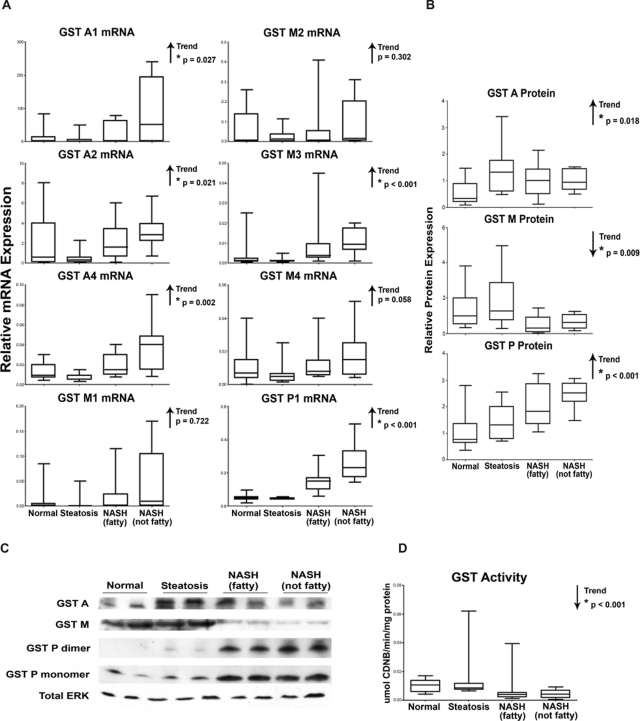
Fig. 3.
GST isoform expression and activity. Messenger RNA (A), densitometric analysis of protein levels of GST isoforms (B), representative immunoblots of GST families (C), and pan-GST enzymatic activity (D) in human liver samples diagnosed as normal, steatotic, NASH (fatty), and NASH (not fatty). A, mRNA levels for specific GST isoforms (GST A1, A2, A4, M1, M2, M3, M4, and P1) were measured by reverse-transcriptase polymerase chain reaction and expressed as relative mRNA expression to glyceraldehyde-3-phosphate dehydrogenase. B, protein levels of GST families (GST A, GST M, and GST P) were determined by immunoblot analysis and expressed as relative to control protein (Total ERK). C, a representative immunoblot of GST A, GST M, and GST P monomer and dimer with total ERK is shown using two samples from each diagnostic category. D, GST activity was determined spectrophotometrically using CDNB as a pan-GST substrate and is expressed as micromoles per minute per milligram protein. Arrows indicate an increasing or decreasing trend. *, statistically significant trend as determined by nonparametric trend analysis (p ≤ 0.05).

