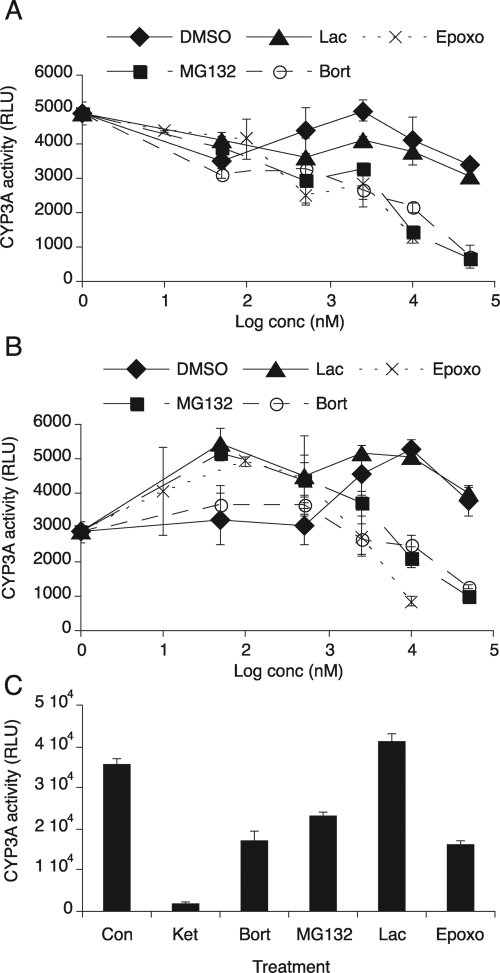
Fig. 5.
Effect of proteasome inhibitors on CYP3A activity. CYP3A activity was measured by using the P450-Glo CYP3A4 assay system with Luciferin-PPXE as a substrate of CYP3A. A, CYP3A activity in pooled human liver microsomes. Luciferin-PPXE (100 μM) was mixed with either DMSO as a control or various concentrations (0.05–50 μM) of MG132, lactacystin (Lac), or bortezomib (Bort) or 0.01 μM to 10 μM epoxomicin (Epoxo) and then incubated with microsomes (1 μg/ml) for 10 min. The reaction was started by addition of NADPH. After 30 min, luminescence was measured with a luminometer. B, CYP3A4 activity in CYP3A4 Supersomes. Luciferin-PPXE was mixed with either DMSO as a control or various concentrations of proteasome inhibitors as described above and then incubated with CYP3A4 Supersomes (0.5 μg/ml) for 10 min. Thirty minutes after addition of NADPH to the reaction, luminescence was measured with a luminometer. C, hepatocellular CYP3A activity. Two-day PB-treated primary human hepatocytes (HH1425) were incubated with various proteasome inhibitors [20 μM MG132, 20 μM bortezomib, 10 μM clasto-lactacystin β-lactone (Lac), or 2.5 μM epoxomicin] or 20 μM ketoconazole (Ket) as a positive control (Con). Four hours later, hepatocytes were incubated with 25 μM Luciferin-PPXE for 1 h, and the media were collected for luminescence assay as described above. Values are the mean ± S.D. of three independent samples. RLU, relative light units.

