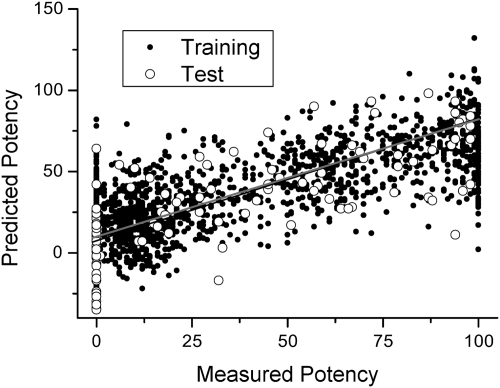
Fig. 3.
Correlation between measured inhibitory potency values and values predicted by PLSR from a training (closed circles) set of 95% of the compounds in S469 (R2 of 0.60). Open circles indicate values predicted by the PLSR model for a test set of the remaining 5% of the compounds (R2 of 0.53, gray line), showing successful prediction of isoform-specific inhibition.

