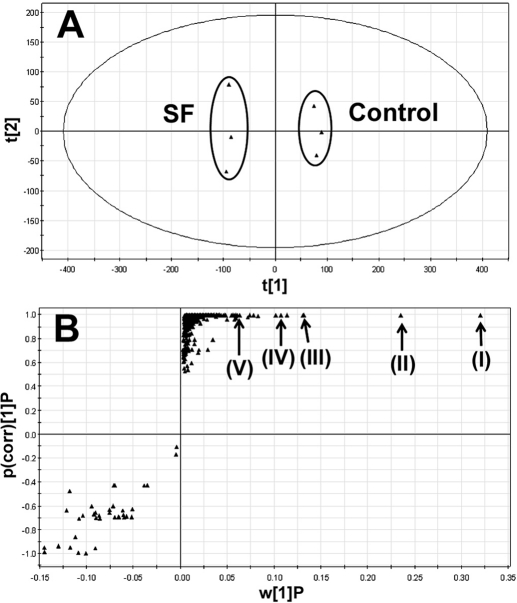
Fig. 2.
Global profiling of the chemical constituents of SF aqueous extract using a liquid chromatography-mass spectrometry-based metabolomic approach. UPLC-TOFMS was used to analyze SF constituents. Centroid and integrated mass chromatographic data were processed by MarkerLynx software to generate a multivariate data matrix. PCA and OPLS-DA were conducted on Pareto-scaled data to analyze the chemical constituents of SF. A, separation of SF aqueous extract group and vehicle group in a PCA score plot. The t[1] and t[2] values represent the scores of each sample in principal component 1 and 2, respectively. B, loading S-plot generated by OPLS-DA. The y-axis represents the correlation of each ion to the model, and the x-axis represents the relative abundance of ions. The ions from SF aqueous extract are presented in the upper-right window, and several top-ranking ions were identified as oxymatrine (I), oxysophocarpine (II), matrine (III), sophocarpine (IV), and N-methylcytisine (V).

