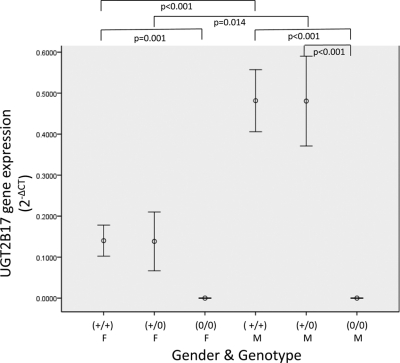
Fig. 1.
UGT2B17 gene expression by sex and deletion genotype in human liver specimens. Real-time PCR of UGT2B17 from 103 human liver cDNA specimens was performed in triplicate. The y-axis displays the amount of UGT2B17 gene expression relative to PPIA (presented as 2−ΔCT). Sex [female (F) and male (M)] and UGT2B17 deletion genotype [(+/+), (+/0), and (0/0)] are shown on the x-axis. Only significant comparisons are shown (p < 0.05).

