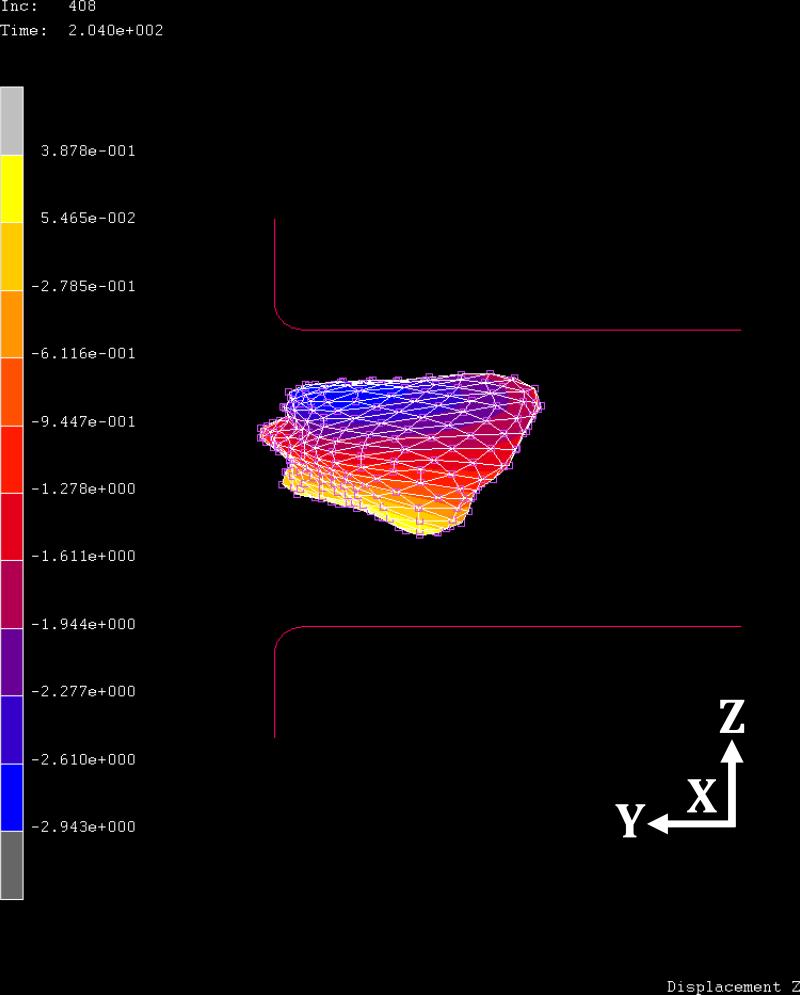
Fig. 9.
The corresponding side view of the deformation of fibroglandular tissue of Fig. 7 for case #2 with CC view compression at 60% compression ratio. The blue and yellow color bars indicate the minimum and maximum values of displacements, in which the range of displacement in the z-axis direction is -2.94 to 0.38 cm.

