
Fig. 3.
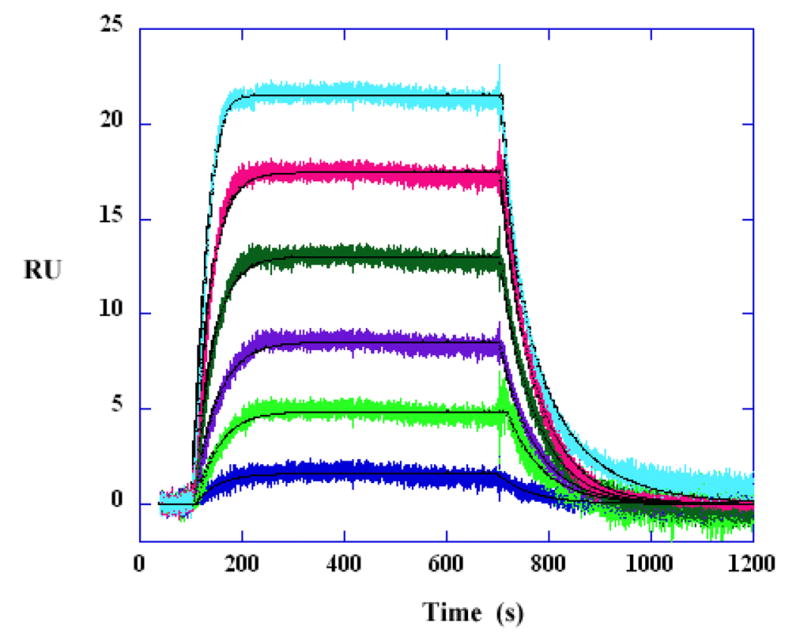
Kinetic fitting to the AATT DNA data at low compound concentrations. The DB293 concentrations from bottom to top are 1, 4, 6, 10, 15 and 20 nM. The kinetic analysis is performed with mass transport kinetic 1:1 binding model. The smooth lines are the best fit lines using global fitting.