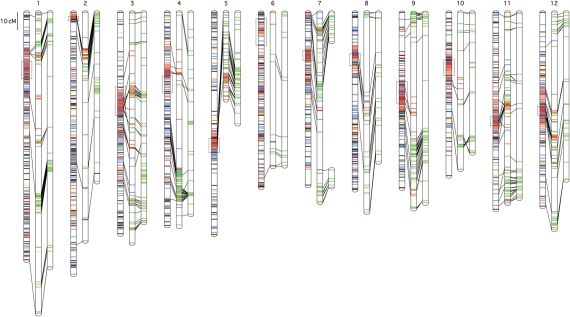
Figure 1.
Intraspecific linkage maps for tomato. The middle and right bars of each linkage group represent maps of the AMF2 and MMF2 lines, respectively. The left bar represents a linkage map of Tomato-EXPEN 2000, which is an interspecific map constructed in our previous study.7 The lines on each linkage group show SNP (green), TGS (red), TES (blue), TEI (yellow), and the other available (black) markers. Common markers between two maps are connected with black lines. Boxes on the Tomato-EXPEN 2000 map indicate heterochromatic regions. Detailed information on the markers, including marker positions, is shown in Supplementary Table S1, and is also available at http://www.kazusa.or.jp/tomato/.

