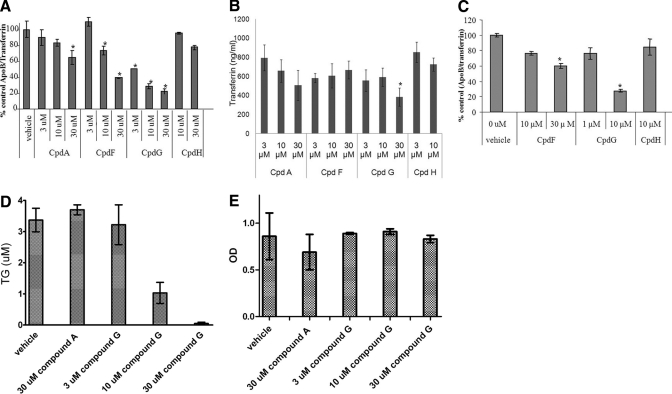
Fig. 4.
A and C, effects of the compounds on ApoB secretion in HepG2 cells (A) and Huh7 cells (C). A–C, HepG2 or Huh7 cells were treated with the compounds (Cpd) for 24 h, and medium was collected for apoB (A and C) and transferrin (B) measurement by ELISA. ApoB levels normalized to transferrin are presented. B, transferrin levels from experiments shown in A. *, P < 0.05. D, effects of compounds on triglyceride secretion in HepG2 cells. Cells were treated with compounds for 24 h, and medium was harvested to measure triglyceride levels as described under Materials and Methods. E, MTT cytotoxicity for experiment shown in C. Cells were incubated with MTT reagent, and cytotoxicity was measured as described under Materials and Methods. Data are the average of triplicates ± standard deviation.

