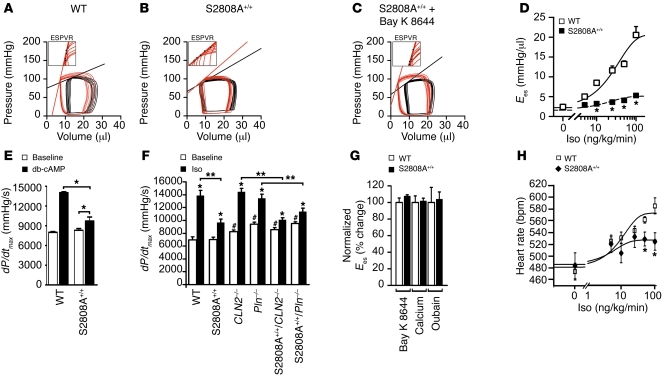
Figure 2. Blunted cardiac response to acute β-adrenergic stimulation in RyR2-S2808A+/+ mice.
(A–C) Pressure-volume loops before (black) and during (red) Iso (100 ng/kg/min i.v.) infusion. (A) The steeper and left-shifted Ees line indicates increased contractility as evidenced in WT, which is blunted in (B) RyR2-S2808A+/+ mice. (C) Treatment with Bay K 8644 (100 μg/kg i.p.) restored the inotropic response in RyR2-S2808A+/+ mice. Insets show representative examples of end-systolic pressure-volume relationships (ESPVRs) during β-adrenergic stimulation; Ees is determined by the slope of the automated end-systolic pressure-volume relationship regression analysis through a series of end-systolic points (black dots). (D) Ees response to gradually increasing Iso (0–100 ng/kg/min) and sigmoid regression analysis (n = 10 for each genotype; *P < 0.05 each versus WT). (E) dP/dtmax of WT and RyR2-S2808A+/+ mice prior to and after db-cAMP infusion (*P < 0.05). (F) dP/dtmax prior to and after treatment with Iso (100 ng/kg/min i.v.), according to genotype as indicated (calstabin2, referred to herein as CLN2–/–; phospholamban, Pln–/–; and crossed mouse strains as indicated) (*P < 0.05 versus baseline; #P < 0.05 versus WT baseline; **P < 0.05). (G) Ees change normalized to WT after treatment with inotropic agonists Bay K 8644 (100 μg/kg i.p.), Ca2+ (30 mg/kg/min i.v.), or ouabain (0.1 mg/kg/min i.v.) (P = NS versus WT; n = 5). (H) Heart rates in response to gradually increasing Iso concentrations (0–100 ng/kg/min) and sigmoid regression analysis from D (n = 10 for each genotype; *P < 0.05).

