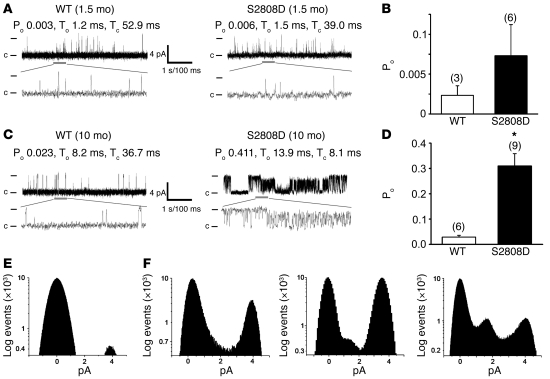
Figure 4. Functional characterization of cardiac RyR2 channels from WT and RyR2-S2808D+/+ mice.
(A) Representative single channel current traces of cardiac RyR2 channels isolated from WT and RyR2-S2808D+/+ mice at 1.5 months of age. (B) Bar graph summarizing average Po in WT (n = 3) and RyR2-S2808D+/+ (n = 6) channels from 1.5-month-old mice (P = NS). The number of channels recorded from each sample is indicated by the parenthetical numbers over each bar. (C) Representative single channel current traces of cardiac RyR2 channels isolated from 10-month-old WT and RyR2-S2808D+/+ mice. (D) Bar graph summarizing average Po in WT (n = 6) and S2808D+/+ (n = 9) channels from 10-month-old mice (*P < 0.05). The number of channels recorded from each sample is indicated by the parenthetical numbers over each bar. Channel openings are shown as upward deflections; the open and closed (c) states of the channel are indicated by horizontal bars in the beginning of each trace. Examples of the channel activity are shown at 2 different time scales (5 s for upper trace and 500 ms for lower trace depicted by the thick gray bar) as indicated by dimension bars. The respective Po, To (average open time), and Tc (average closed time) are shown above each 5 second trace and correspond to that particular experiment. (E) Amplitude histogram of a representative WT cardiac RyR2 channel (at 10 months old), showing 2 distinct peaks corresponding to fully open (~4 pA) and closed (0 pA) states of the channel. (F) Samples of amplitude histograms from 3 different experiments, using RyR2-S2808D+/+ channels (10-month-old mice), showing subconductance states.

