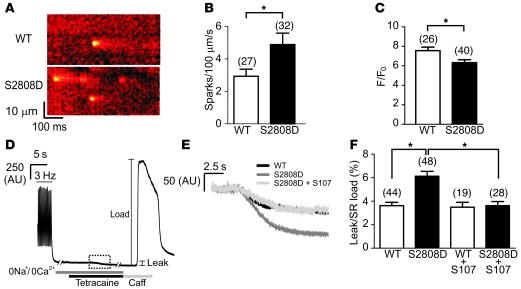
Figure 5. Reduced store content and increased diastolic Ca2+ leak in RyR2-S2808D+/+ mice.
(A) Representative line scans obtained from ventricular myocytes isolated from WT and RyR2-S2808D+/+ mice, showing an increased spark frequency in RyR2-S2808D myocytes. (B) Pooled data showing mean ± SEM spark frequency from the number of myocytes indicated parenthetically. *P < 0.05. (C) Pooled data showing mean ± SEM amplitude of caffeine-evoked signals from the number of cells indicated parenthetically. *P < 0.05. (D) Representative trace depicting the protocol for determining the level of SR Ca2+ leak in ventricular myocytes. After termination of 3-Hz pacing, cells were superfused with Na+- and Ca2+-free solution. Application of tetracaine (1 mM) reduced the baseline fluorescence (leak). Caffeine (Caff; 10 mM) was applied at the end of the protocol to assess the SR Ca2+ load. The box made of dashed lines indicates the region expanded in E. (E) Representative signals during tetracaine application from WT, RyR2-S2808D+/+, and S107-treated RyR2-S2808D+/+ myocytes. (F) Pooled data from the number of cells indicated parenthetically, showing the mean ± SEM leak/load relationship of WT and RyR2-S2808D+/+ myocytes in the presence and absence of S107 (1 μM). Values represent the magnitude of reduction due to tetracaine expressed as a percentage of the increase in signal in response to caffeine (*P < 0.05). Myocytes were prepared from 5 or 6 mice in each experimental group.

