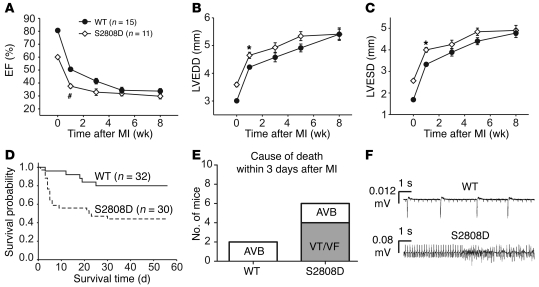
Figure 7. Increased mortality after MI in RyR2-S2808D+/+ mice.
(A–C) Serial echocardiographic measurements after MI. (D) Kaplan-Meier survival curve of RyR2-S2808D+/+ mice (n = 30) and WT littermates (n = 32) after MI. The solid line represents WT mice, and the dashed line represents RyR2-S2808D+/+ mice. (E) Telemeters were implanted in WT (n = 8) and RyR2-S2808D (n = 8) mice and cause of death within 3 days after MI was determined. AVB, atrial-ventricular block; VF, ventricular fibrillation; VT, ventricular tachycardia. (F) Representative telemetry traces depicting atrial-ventricular block in a WT mouse and ventricular tachycardia in a RyR2-S2808D+/+ mouse after MI. #P < 0.01 versus WT; *P < 0.05 versus WT.

