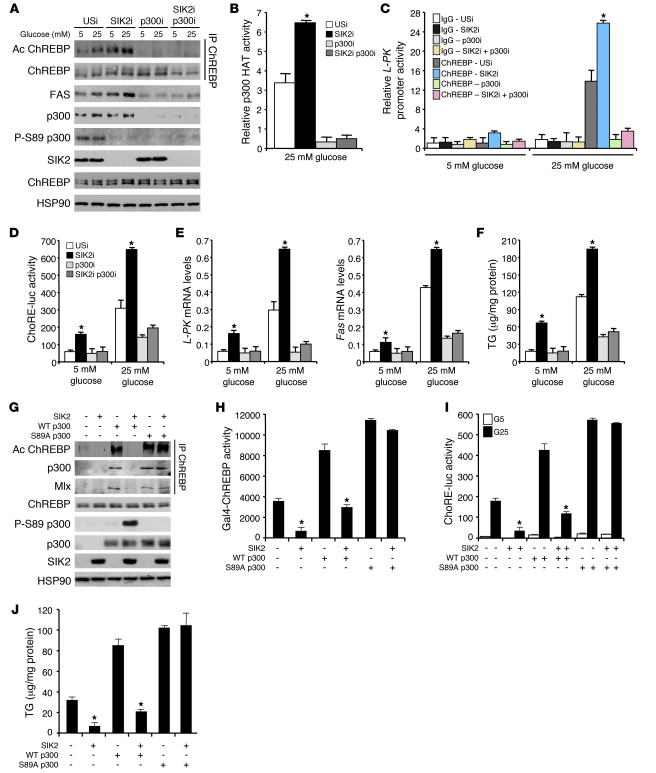
Figure 5. SIK2 regulates ChREBP transactivation activity through p300 phosphorylation.
(A–F) Effects of SIK2 and p300 silencing on glucose and lipid metabolism were studied in hepatocytes incubated in the presence of insulin (100 nM) and either 5 or 25 mM glucose for 18 hours. (A) Levels of p300 Ser89 phosphorylation and acetylated ChREBP. Data are representative of 3 independent experiments. (B) Relative p300 HAT activity in hepatocytes incubated with 25 mM glucose and 100 nM insulin. Data are the average of 3 independent experiments (mean ± SEM; *P < 0.05). (C) ChREBP recruitment to the ChoRE-containing region of the L-PK promoter. Data are the average of 3 independent experiments (mean ± SEM; *P < 0.05). (D and E) ChoRE-luc reporter activity and L-PK and Fas expression measured by quantitative PCR. Data are the average of 3 independent experiments (mean ± SEM; *P < 0.05). (F) Hepatic TG concentrations. Data are representative of 3 independent experiments (mean ± SEM; *P < 0.01). (G–I) HepG2 cells were transfected with either WT or S89A p300 expression vector with or without SIK2. (G) ChREBP acetylation levels. The amount of total ChREBP and p300 is shown. Data are representative of 3 independent experiments. (H and I) Gal4-ChREBP transactivation and ChoRE-luc activities. Data are representative of 3 independent experiments (mean ± SEM; *P < 0.05). (J) TG content. Data are representative of 3 independent experiments (mean ± SEM; *P < 0.05).

