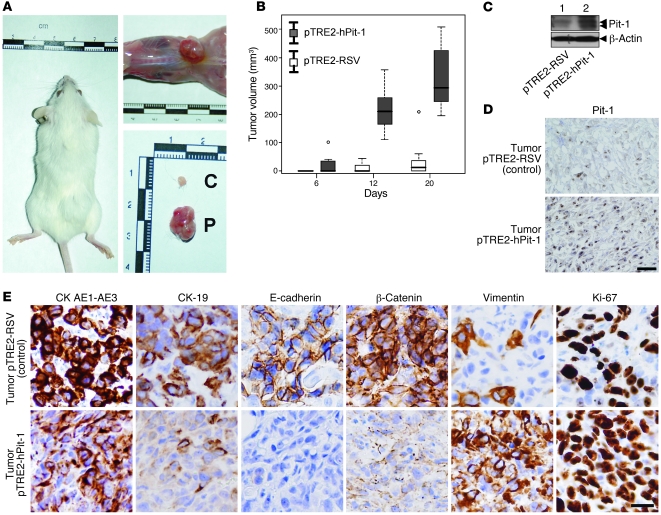
Figure 4. Subcutaneous injection of Pit-1–overexpressing MCF-7 cells in SCID mice increases tumor growth and induces EMT.
(A) Seven SCID mice were subcutaneously injected with control MCF-7 cells (left flank) or MCF-7 cells stably transfected with Pit-1 expression vector (right flank). C, control cells; P, Pit-1–overexpressing MCF-7 cells. (B) Box plot of tumor growth in SCID mice, as described in A. The bottom and the top of the boxes represent the first and third quartiles (i.e., the 25th and 75th percentile, respectively), and the bands near the middle of each box represent the 50th percentile (the median). The ends of the whiskers represent the lowest and the highest values still within 1.5 interquartile range of the lower and upper quartiles, respectively. (C and D) Western blot and immunohistochemistry of Pit-1 in tumors of SCID mice injected with MCF-7 control cells stably transfected either with the pTRE2-hPit-1 expression vector or the control vector (pTRE2) at day 20. Double arrowheads in the Pit-1 immunoblot indicate 33-kDa and 31-kDa immunoreactive bands. Scale bar: 40 μm. (E) Immunohistochemistry analysis of epithelial (CK AE1-AE3, CK-19, E-cadherin, and β-catenin), mesenchymal (vimentin), and proliferation (Ki-67) markers in tumors of SCID mice injected with control or Pit-1–overexpressing MCF-7 cells. Scale bar: 25 μm.

