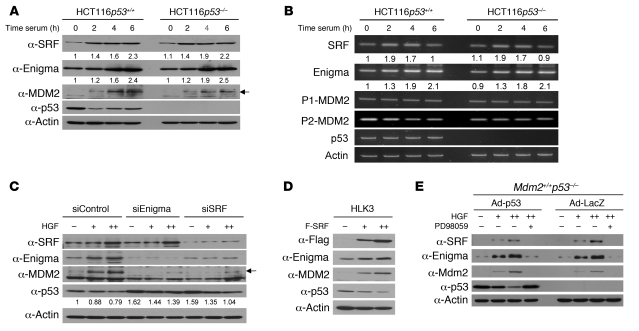
Figure 4. Proliferation signal attenuates p53 by the SRF/Enigma/MDM2 pathway in cells.
(A and B) We incubated serum-starved cells in DMEM with 10% FBS (serum) for the indicated times, prepared protein lysates or total RNAs, and analyzed them by IB (A) or RT-PCR (B) as indicated. SRF and Enigma levels from 3 independent experiments were quantified by densitometry. Mean values are expressed relative to the band intensity of the first lane in Figure 4. A and B, respectively, which was arbitrarily defined as 1. (C) We transfected HLK3 cells with indicated siRNA vectors (10 μg each), incubated them in DMEM without serum for 48 hours, and incubated them in DMEM with HGF (0, 40, 60 ng/ml) for 4 hours before IB as indicated. p53 levels were quantified by densitometry, and mean values are expressed relative to the band intensity of the first lane in Figure 4C, which was arbitrarily defined as 1. Arrows in A and C indicate MDM2 band. (D) We transfected cells with F-SRF vector (0, 5, 10 μg) and incubated them for 48 hours before IB as indicated. (E) We transduced MEFs with Ad-p53 or Ad-LacZ at an MOI of 100, incubated them in DMEM without serum for 48 hours, and further incubated them in DMEM with HGF (0, 40, 60 ng/ml) in the presence or absence of 25 μM PD98059 for 4 hours before IB as indicated.

