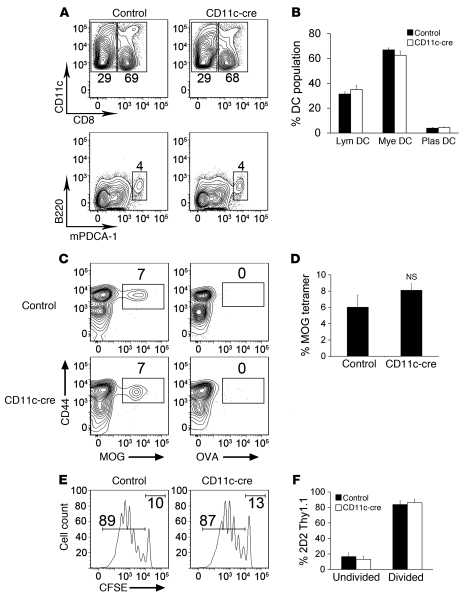
Figure 4. Characterization of draining lymph node DCs in β8fl/fl × CD11c-cre mice.
(A) Flow cytometry plots of MHCII+CD11c+ DCs isolated from the draining lymph nodes of control or β8fl/fl × CD11c-cre mice 7 days after in vivo stimulation with CFA. DCs within plots are gated on CD8+ (lymphoid) and CD8– (myeloid) DCs (top) or B220+mPDCA-1+ (plasmacytoid; bottom). Numbers next to the gates indicate the percentage of CD8+ or CD8– MHCII+CD11c+ cells (top) or B220+mPDCA-1+MHCII+CD11c+ cells (bottom). (B) Percentage of lymphoid (Lym), myeloid (Mye), and plasmacytoid (Plas) DCs isolated from control β8fl/fl × CD11c-cre mice. (C) Flow cytometry plots of CD4+ T cells isolated from control or β8fl/fl × CD11c-cre mice 7 days after immunization with MOG plus CFA and stained with MHCII tetramers loaded with MOG or OVA peptide. Numbers above the gates indicate the percentage of cells labeled with tetramer after enrichment for tetramer-positive cells. (D) Percentage of CD4+ T cells labeled with MOG tetramer after enrichment for tetramer-positive cells isolated from control or β8fl/fl × CD11c-cre mice. (E) Flow cytometry histograms of CFSE-stained Thy1.1+2D2+ TCR transgenic T cells isolated from control or β8fl/fl × CD11c-cre mice 7 days after immunization with MOG plus CFA. Numbers above gates indicate the percentage of divided (left gate) and undivided (right gate) cells. (F) Percentage of undivided and divided 2D2+ Thy1.1+ cells isolated from control or β8fl/fl × CD11c-cre mice.

