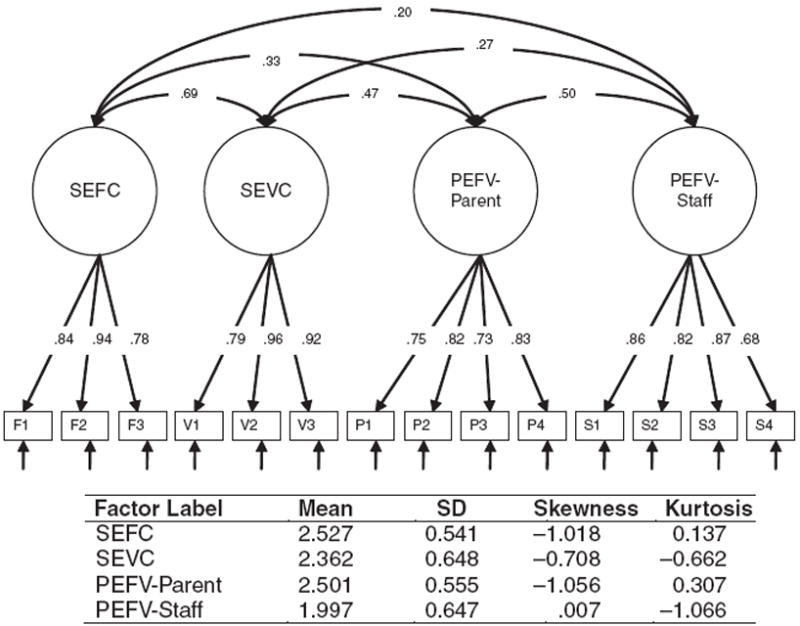
Figure 1.

Path diagram of model, including standardized factor scores and correlations. NOTE: The table includes mean, standard deviation, skewness, and kurtosis statistics for self-efficacy for fruit (SEFC), self-efficacy for vegetables (SEVC), proxy efficacy from parent (PEFV-P) and proxy efficacy from after-school staff (PEFV-S). All indicators measured on scales ranging from 1 to 3 (higher scores reflect higher levels of the assessed latent construct); N = 232.
