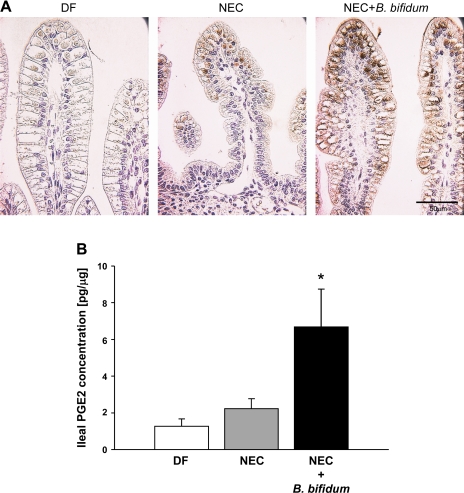
Fig. 2.
Effect of B. bifidum treatment on cyclooxygenase-2 (COX-2) expression and prostaglandin E2 (PGE2) production in the ileal tissue. A: ileal tissue stained for COX-2; representative slides from DF, NEC, and NEC + B. bifidum groups are shown (n = 6 animals/experimental group). Magnification: ×400. B: PGE2 concentration (pg/ml) in ileal homogenates of DF (n = 7), NEC (n = 7), and B. bifidum-treated animals (n = 7) calculated per 1 μg of protein. *P ≤ 0.05 vs. NEC and DF.

