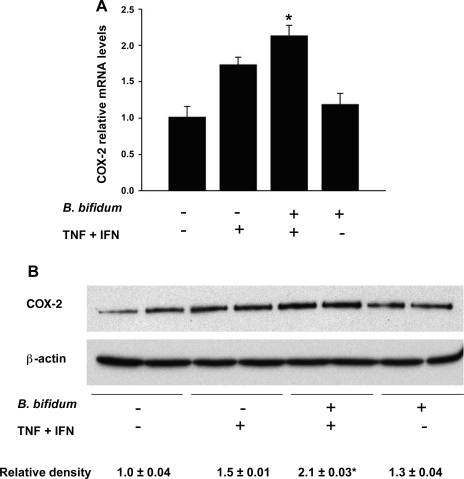
Fig. 5.
Evaluation of COX-2 in IEC-6 cells. Cells were treated with or without TNF-α and IFN-γ (400 ng/ml each) for 4 h with or without pretreatment for 15 min with B. bifidum. A: COX-2 mRNA levels evaluated using real-time PCR. The mean steady-state mRNA level for the control group (no treatment) was assigned a value of 1.0, and mean mRNA levels for all other groups were determined relative to this number. *P ≤ 0.05 vs. control (no treatment) and B. bifidum (+) TNF + INF (−). B: representative COX-2 (70-kDa) bands from Western blot analyses of IEC-6 cell lysates. Mean relative density to β-actin is shown for all groups. *P ≤ 0.05 vs. control (no treatment); B. bifidum (−) TNF + INF (+); and B. bifidum (+) TNF + INF (−).

