Fig. 6.
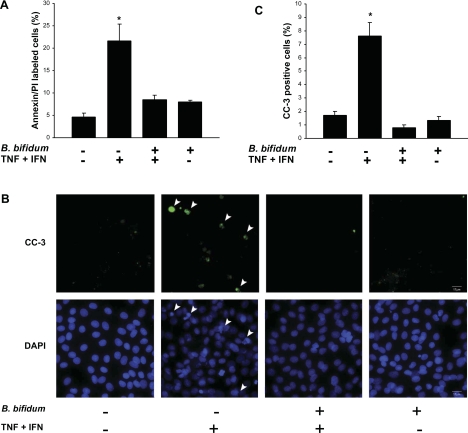
Apoptosis in IEC-6 cells and the effect of B. bifidum pretreatment. Cells were treated with or without TNF-α and IFN-γ (400 ng/ml each) for 4 h and with or without a 15-min pretreatment with B. bifidum. A: percentage of annexin/propidium iodide (PI)-labeled cells analyzed by flow cytometry. *P ≤ 0.05 vs. control (no treatment); B. bifidum (+) TNF + INF (+); and B. bifidum (+) TNF + INF (−). B: CC-3-stained cells evaluated by fluorescent microscopy. Arrowheads indicate representative apoptotic cells/nuclei. Magnification: ×400. C: the percentage of CC-3-positive cells. *P ≤ 0.05 vs. control (no treatment); B. bifidum (+) TNF + INF (+); and B. bifidum (+) TNF + INF (−).

