
Figure 10.
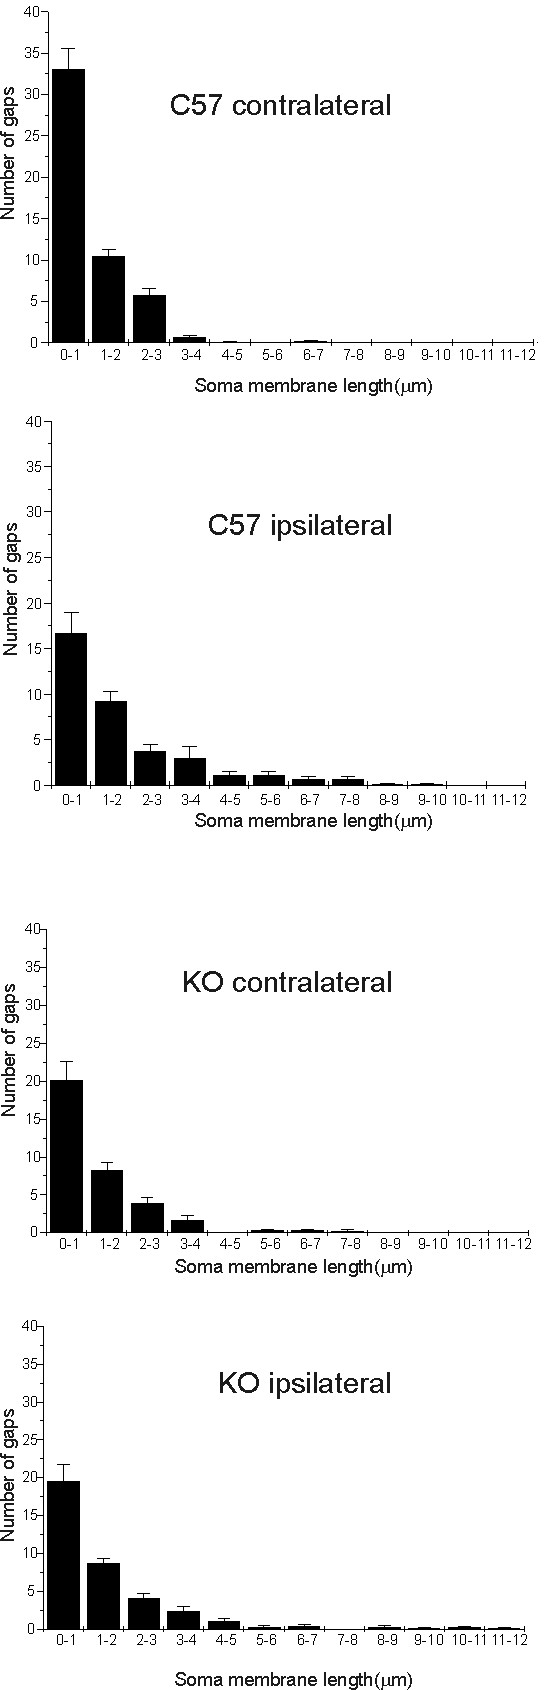
Graphs showing the frequency distribution (in micrometers) of gaps between the terminals along the cell soma membrane of α-motoneurons. (A-B) C57BL/6J animals showed a higher synaptic elimination one week after lesion. The gaps between clusters of boutons are possibly increased due to selective retractions of inputs. (C and D) IFNγ-KO mice showed a lower retraction of terminals after nerve lesion.