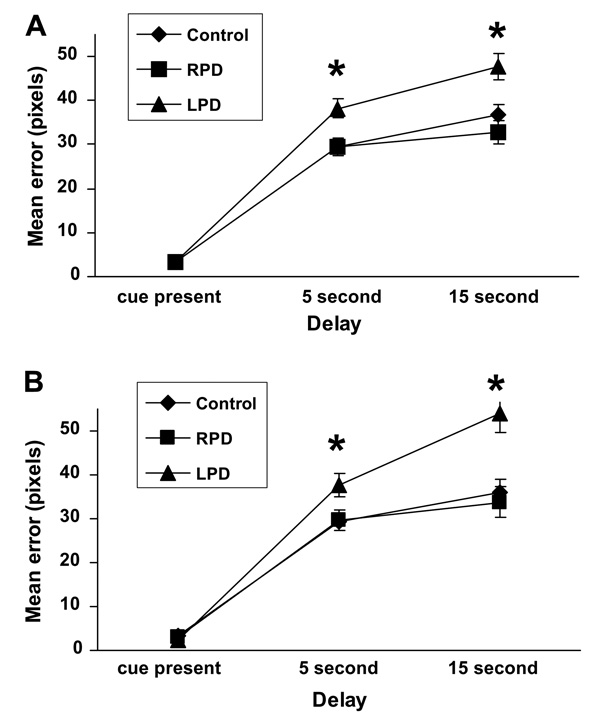
Fig. 2.
Group differences in SDR performance error (mean ± SEM) across delay conditions for (A) the entire group of participants (control, n = 28; RPD, n = 19; LPD, n = 16), and (B) the MRI subset (control, n = 15; RPD, n = 11; LPD, n = 8) after controlling for age and WRAT-3R score. * LPD>RPD and control, p < 0.01.

