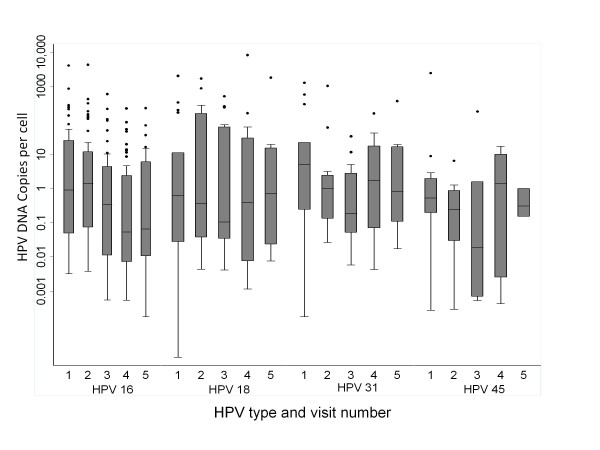
Figure 1.
HPV loads (HPV DNA copies per cell) at enrolment and at follow-up visits (total 5 visits) among HPV-positive women for the 4 genotypes studied (Y-axis in log scale). The length of each box corresponds to the interquartile range, with the top boundary of the box representing 75th and bottom boundary the 25th percentile. The horizontal line in the box indicates the median value. Outlier values are shown in circles outside the boxes.

