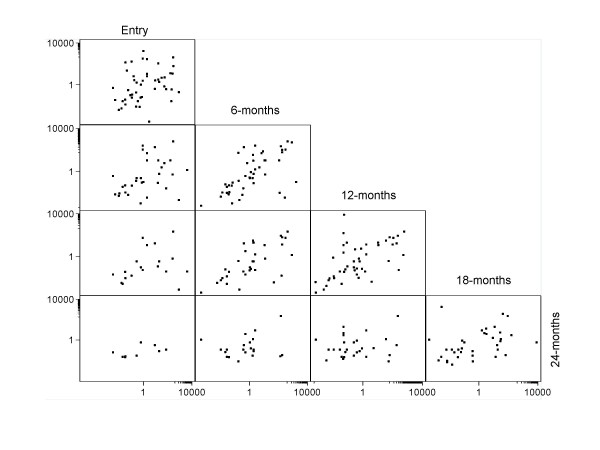
Figure 2.
Between-visit correlation graphs of viral load measurements of four combined HPV types (HPV-16, 18, 31, 45) at enrolment and follow-up visits (see material and methods). For example, the upper left graph shows viral load at entry versus viral load at 6 months, the lower left graph shows viral load at entry versus viral load at 24 months.

