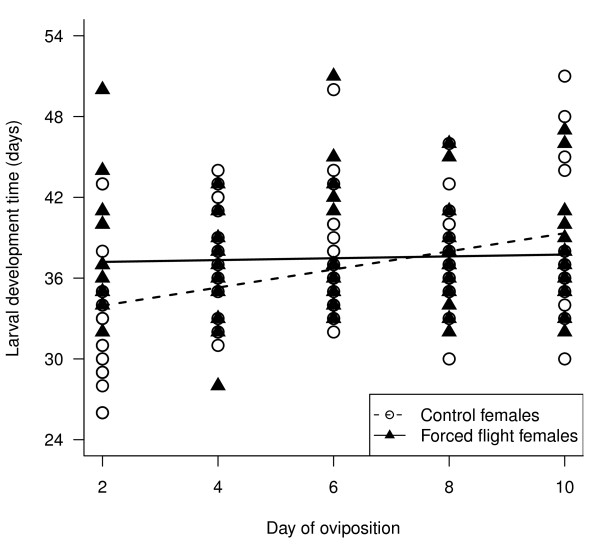
Figure 6.
Total larval development time (days) of the larvae that successfully pupated for each of the sampled oviposition days. Larvae had mothers that either had been forced to fly or were controls as indicated. For each of these two groups the linear relationship between development time and day of oviposition is indicated as modelled in the random slope lme model (see text). Full fitted random slope lme model: √(larval development time) = egg size + day of oviposition + flight treatment + flight treatment*day of oviposition + viral treatment + sex.

