Figure 5.
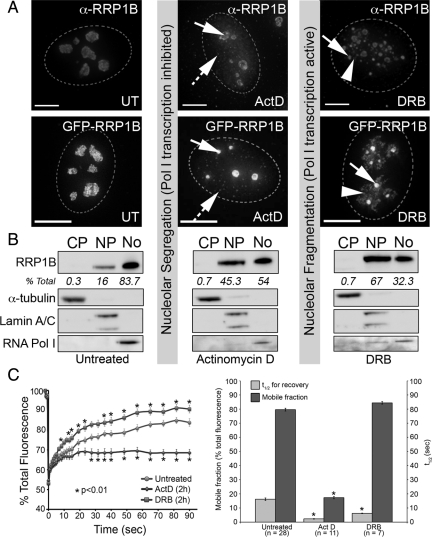
Relocalization and altered dynamics of RRP1B in response to drugs that induce nucleolar segregation. (A) Treatment with actinomycin D (ActD) at a concentration that inhibits both RNA Pol I and II (2.5 μg/ml for 2 h) leads to a redistribution of a pool of nucleolar RRP1B to the nucleoplasm. The nucleoplasmic pool of RRP1B includes small foci distributed throughout the nucleus (hashed arrows). The remaining nucleolar RRP1B is retained in both the central body (arrow) and at the nucleolar periphery. GFP-RRP1B shows a similar relocalization in response to ActD treatment. Treatment with DRB (25 μg/ml for 2 h) leads to a breakdown in nucleolar structure and redistribution of RRP1B to small granules (arrows) and additional masses surrounding these granules (arrowheads). GFP-RRP1B shows a similar response. Scale bars are 15 μm. (B) Untreated, ActD-treated, and DRB-treated U2OS cells were fractionated into cytoplasm, nucleoplasm, and nucleoli, and cell-equivalent volumes of each separated by SDS-PAGE and transferred to nitrocellulose membrane for Western blot analysis. Antibodies raised against markers for the cytoplasm (α-tubulin), nucleus (lamin A/C), and nucleolus (RNA Pol I subunit A190) demonstrate the purity of the subcellular fractions. Staining with the antibodies raised against endogenous RRP1B revealed that it is predominantly nucleolar (83.7%) in untreated cells, with 16% found in the nucleoplasm and 0.3% in the cytoplasm. This distribution changes after both ActD and DRB treatment, with a large increase in the nucleoplasmic fraction (45.3 and 67%, respectively) and decrease in the nucleolar fraction (54 and 32%, respectively). RRP1B is not found in appreciable amounts in the cytoplasm under any of these conditions. (C) Photobleaching analysis of nucleolar GFP-RRP1B in U2OSGFP-RRP1B cells reveals that ActD treatment leads to a significant reduction in the mobile fraction. DRB treatment does not alter the mobile fraction, however there is a significant decrease in the t1/2 of recovery. For each condition, datasets from 10 different cells collected in two separate experiments were averaged and SEs calculated. Asterisks (*) indicate time points at which there is a significant (p < 0.01) alteration from the untreated recovery curve, as calculated by a two-tailed paired Student's t test.

