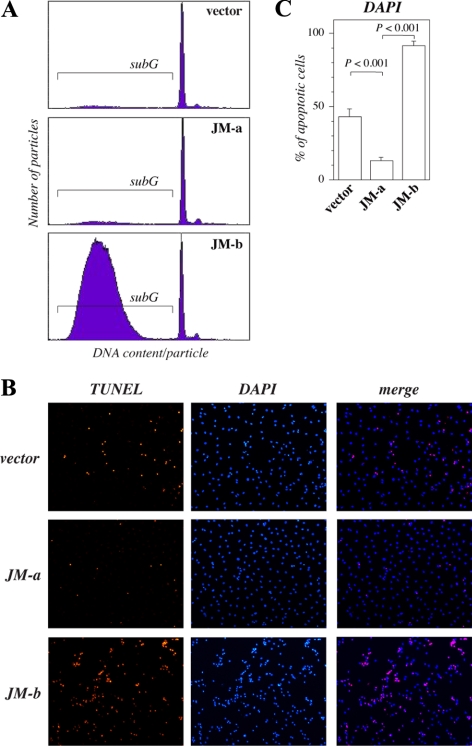
Figure 4.
Starvation-induced death of NR6 cells expressing ErbB4 isoforms. (A) Cells were cultured for 72 h in the absence of FCS, and their DNA contents were analyzed by PI staining and FACS. The proportion of cells containing subG1 quantities of DNA per particle is indicated. (B) Cells were stained with TUNEL (red) and DAPI (blue) after starvation for 2 d and photographed under a fluorescence microscope. (C) The percentage of condensed nuclei stained with DAPI was calculated from five arbitrary fields per cell line under a microscope.

