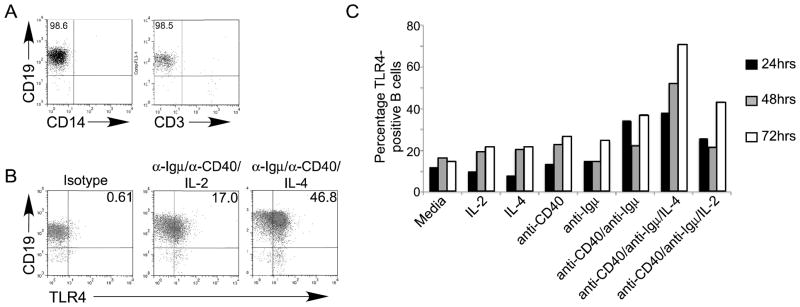
Figure 2.
B cell surface TLR4 increases maximally in response to a combination of stimuli: anti-Igμ, anti-CD40 and IL-4. Purified B cells (A) were stimulated as indicated and surface TLR4 expression was measured as shown in panel B. (C) Percentage of TLR4-positive B cells in cultures incubated for the indicated time (black, gray, and white bars represent 24, 48 and 72 hrs, respectively) and stimulated as shown below X axis. One representative of nine analyses is shown. Note Table 1 includes values of a second representative analysis for comparison. Similar results were obtained with B cells from healthy human spleen (N=1) or peripheral blood (N=2; not shown).

