Figure 1.
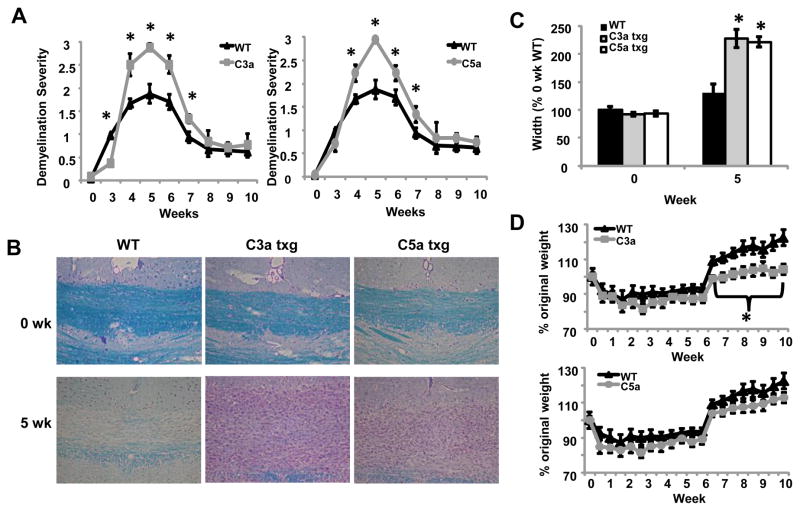
Increased levels of C3a and C5a in the brain lead to exacerbated demyelination and delayed remyelination in the cuprizone model. (A) Mice were treated with cuprizone for the indicated times and the brains were harvested. 5μm sections were stained using LFB-PAS and evaluated by microscopy. The stained sections were blindly scored by three individuals and averaged. Four to eight mice were analyzed per time point for each experimental group. (B) Representative images of LFB-PAS staining at zero and five weeks of cuprizone treatment. Four to eight mice were analyzed for each experimental group. (C) The extent of inflammation in and surrounding the corpus callosum at zero and five weeks was measured in μm using NIS Elements 3.1 Imaging software. In this figure, 100% is the mean width of the inflammatory lesion at midline of the untreated WT group. Four to eight mice were analyzed for each experimental group. (D) Weight of WT and transgenic mice throughout cuprizone treatment. Mice were weighed bi-weekly throughout the ten week study, n = 7–16 mice per group. Statistical significance was calculated using unpaired Student’s t-test and one-way ANOVA, * p < 0.05. Error bars represent standard deviation.

