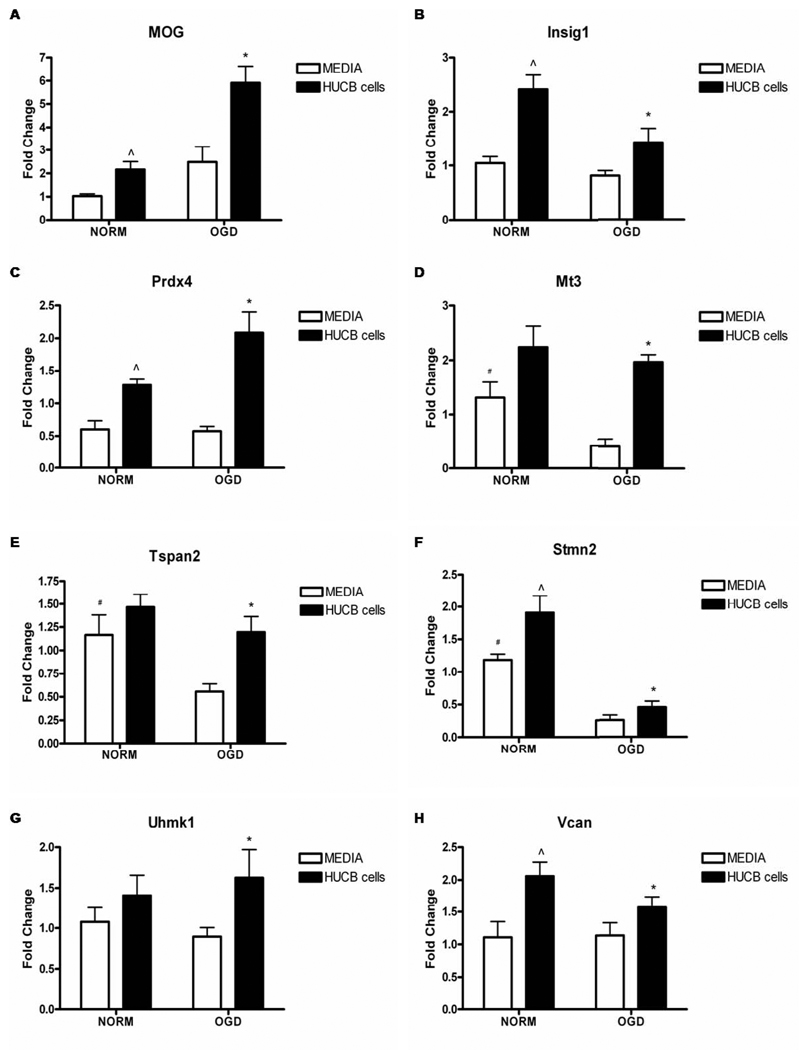
Fig 3. Affymetrix gene array fold changes are confirmed by qRT-PCR.
HUCB cell treatment of OLs exposed to 24 hrs OGD significantly increased gene expression of MOG, Insig1, Prdx4, Mt3, Tspan2, Stmn2, Uhmk1 and Vcan (A–H) as compared to OLs subjected to OGD alone (* p < 0.05, n = 5). Additionally, HUCB cell treatment of OLs exposed to normoxia increased the expression of MOG (A), Insig1 (B), Prdx4 (C), Stmn2 (F), and Vcan (H) as compared to non-treated normoxic controls (^ p < 0.05 n = 5). Under OGD conditions, OL expression of Mt3 (D), Tspan2 (E) and Stmn2 (F) were significantly reduced in non-treated cells compared to both normoxic groups (# p < 0.05, n = 5).

