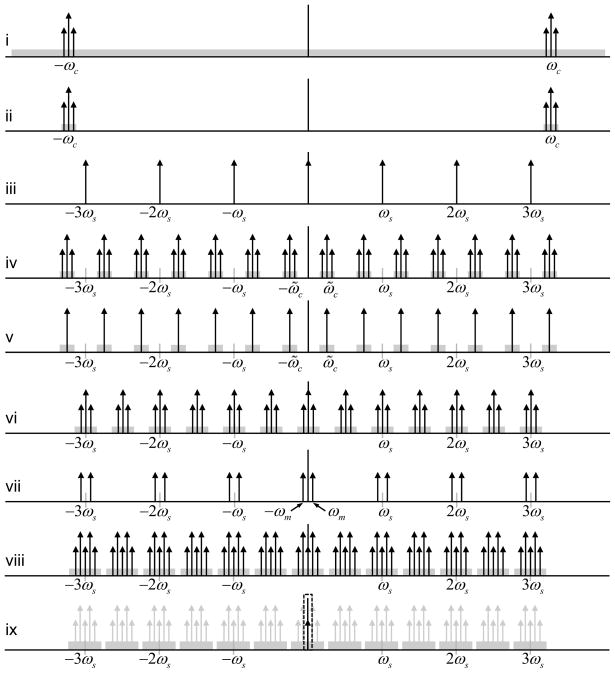
Figure 1.
Frequency domain illustration of digital detection. Reflected EPR signal along with the noise shown in gray (i); reflected signal after bandpass filtering (ii); sampling frequency generated by AWG (iii); sampled bandpass reflected signal (iv); sampled bandpass microwave signal from the microwave source (v); baseband signal SI (or SQ, depending on the phase of microwave signal) obtained by point-by-point time-domain multiplication of iv and v (vi); sampled field modulation signal (vii); point-by-point time-domain multiplication of vi and vii (viii); digital lowpass filtering to obtain one sample of the I1 (or Q1) (ix). For simplicity, only one harmonic is displayed around the microwave carrier.

