
Figure 1. DNA sequence analysis reveals novel mutations in the 5′-UTR of ALDOB.
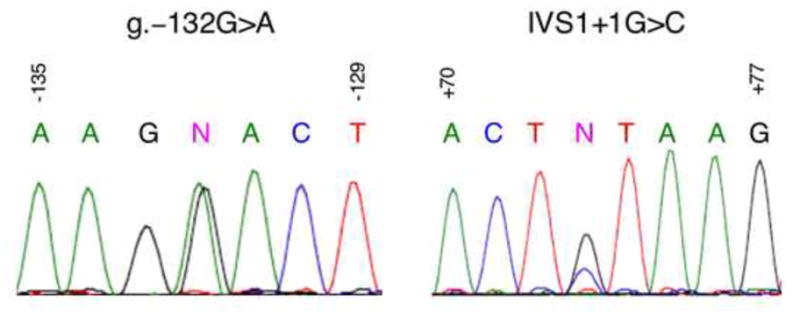
Left, DNA sequence analysis of a 981 bp fragment of the 5′-end of ALDOB performed with the primer 5′-AGCTGTATGACTTAAGGGAACCTCC-3′ revealed a mutation at position −132 in patient 50, indicated by an (N). Right, DNA sequence analysis of a similar fragment from patient 295 performed with the primer 5′-ATCAATCTTGGGCATTTTGCCACCT-3′ revealed a mutation at position IVS1+1, indicated by an (N). The corresponding nucleotide sequence is written above each peak with G (black), A (green), T (red), and C (blue) in corresponding colors.