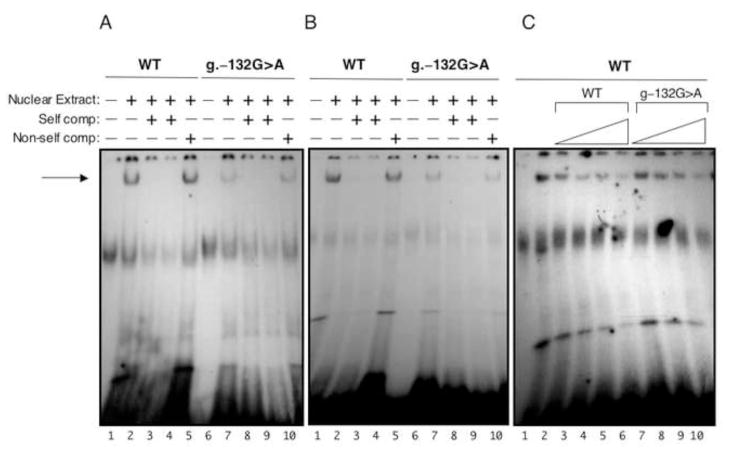
Figure 3. In vitro EMSA analysis.
Panel A, Nuclear extract (10 μg) prepared from A293 cells was incubated with radiolabelled DNA probes that contained either wild type sequence or g.–132G>A mutant sequence (2 × 10⁵ cpm) indicated at the top. Indicated at the bottom, lanes 1 and 6 contained no nuclear extract. Lanes 2 and 7 contained 0.1 pmole of the labeled oligo. Lanes 3 & 8 and 4 & 9 contained 100x and 200x the amount of cold oligo, respectively. Lanes 5 and 10 contained 100x cold non-self competition. Panel B, same as panel A except using nuclear extract from HepG2 cells. Panel C, HepG2 nuclear extract (5 μg) was incubated with 0.04 pmoles (~1.5 × 10⁵ cpm) of radiolabeled wild type oligo as indicated at top. Lane 1 contained no nuclear extract. Lane 2 contained nuclear extract. Lanes 3–10 were incubated with 10x, 25x, 50x, and 100x amounts of the indicated cold oligo. Autoradiography was performed at −90 °C for 16–20 h.

