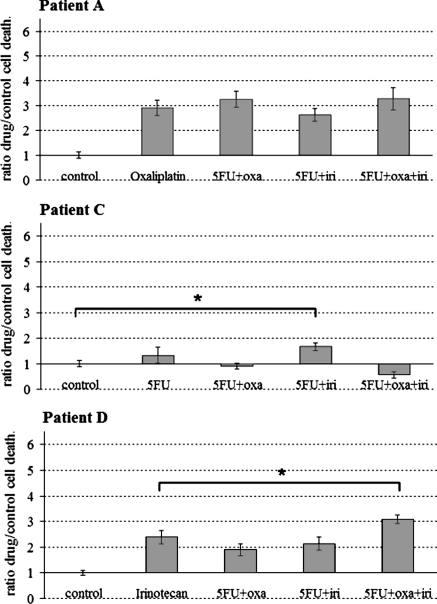
Fig. 4.
Three representative Oncogrammes showing the effects of chemotherapeutics associations on patients’ cell death. After 72 h drug treatment, cell death ratios were compared to the cell death ratio of the most effective agent alone, or to control cell death when any chemotherapeutic was revealed as effective (see Fig. 2) (means ± SEM; * p < 0.05). Oxa: oxaliplatin; iri: irinotecan

