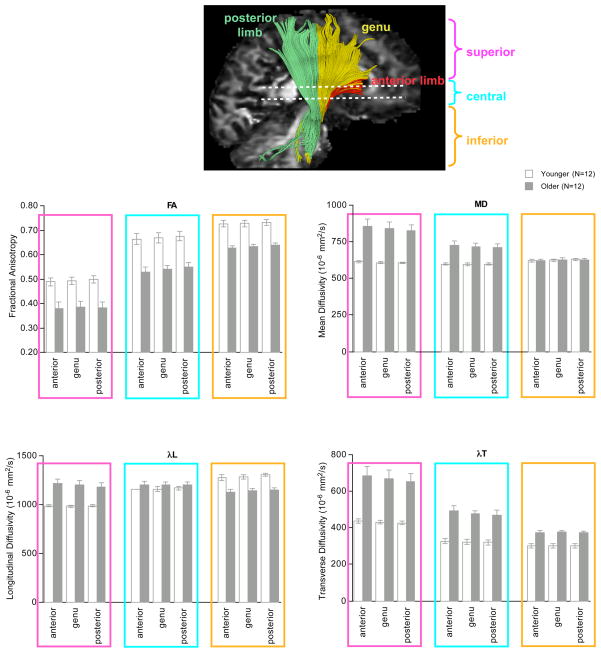
Figure 1.
Top: Midsagittal FA image displaying fiber tracking of the internal capsule divided into its anterior limb, genu, and posterior limb and into superior, central, and inferior divisions. Bar graphs: Mean±standard error FA, MD, λL, and λT of the bilateral anterior limb, genu, and posterior limb of the internal capsule for the younger and older groups. The results are color-coded by superior (magenta), central (turquoise), and inferior (mustard) boxes.

