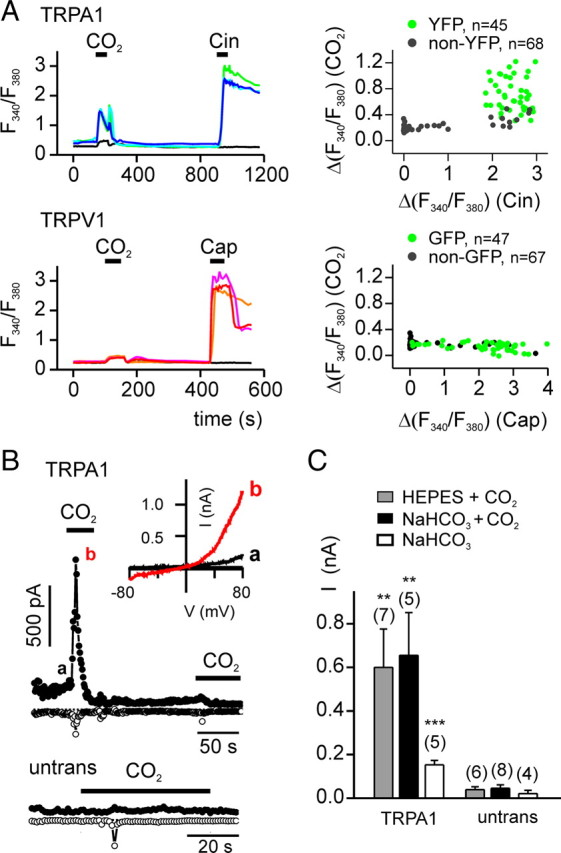
Figure 2.

Carbon dioxide activates TRPA1. A, Agonist-induced elevation of intracellular Ca2+ in HEK-293 cells transfected with TRPA1 or TRPV1, as indicated. TRPA1-expressing cells responded to both CO2 and Cin (100 μm), whereas TRPV1-expressing cells responded only to Cap (1 μm). Right, Scatter plot of the magnitude of the response to CO2 as a function of the response to Cin (top) or Cap (bottom). B, Whole-cell currents evoked in response to CO2 bubbled in HEPES-buffered saline from HEK-293 cells expressing TRPA1. The small inward current in the untransfected cells represents the endogenous ASIC current. Inset, I–V relationship at the times indicated. C, Average data from experiments as in B showing the peak outward current (at 80 mV) evoked in TRPA1-expressing or untransfected (untrans) cells to CO2 in HEPES-buffered saline (HEPES + CO2), CO2 in bicarbonate-buffered saline (NaHCO3 + CO2),or bicarbonate-buffered saline alone (NaHCO3). Data are represented by the mean ± SEM. **p < 0.01, ***p < 0.001 (comparison with untransfected by one-tailed Student's t test).
