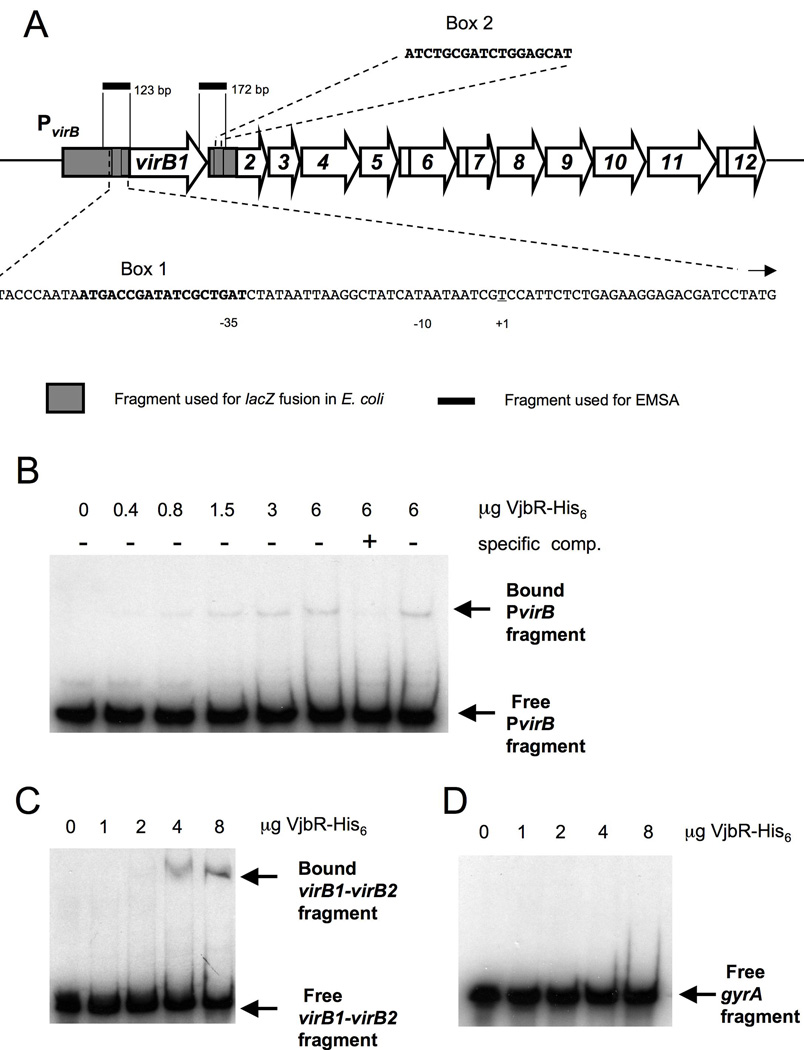
Figure 3.
(A) Schematic representation of the virB operon in the B. abortus chromosome II including PvirB and intergenic regions. The putative PvirB box 1 and box 2 that were used in the first prediction round are shown and the fragments that were used in EMSAs are indicated in black. (B–D) EMSA experiments showing specific binding of VjbR-His6 to regions directly upstream and downstream of virB1(B) VjbR-His6 binding to a 123 bp fragment of PvirB upstream of virB1. In the first lane no VjbR-His6 was added to the binding reaction, and in the subsequent five lanes VjbR-His6 was added in increasing amounts. In lanes 7 and 8 VjbR-His6 protein concentration was the same as in lane 6, but here a 100-fold excess of unlabeled specific (PvirB) or non-specific (vjbR gene) DNA fragment was added to the reaction. (C–D) VjbR-His6 binding to a 172 bp fragment of the virB1-virB2 intergenic region (C), and not to a 139 bp fragment of the gene gyrA (D) when VjbR-His6 was added in the same, increasing amounts to the binding reactions.

