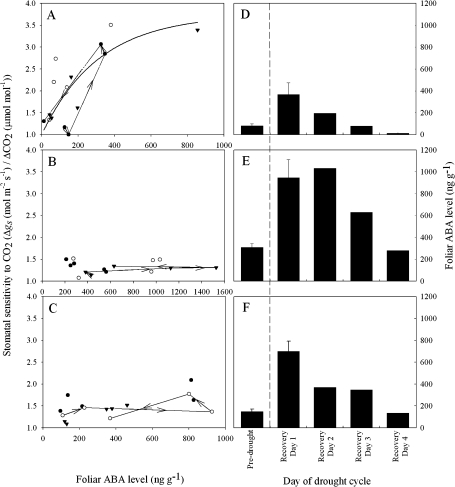
Fig. 3.
Stomatal sensitivity to CO2 relative to foliar ABA level in S. minimus (A), C. rhomboidea (B), and P. radiata (C). Three individuals are represented by different symbols, with a representative individual from each species linked with arrows indicating the transition from two initial well-watered states, two states on the initial day following rewatering, and a subsequent day post-drought recovery. A significant regression (R2=0.57; P <0.01) described the sensitivity of S. minimus stomata to Ca [Ca = 2.745 (1-e-0.0032ABAf)] as indicated by the solid line, although neither conifer species presented a significant relationship. Mean foliar ABA level ±SE (n=3) for pre-drought, and the 4 d post-drought recovery are also shown for S. minimus (D), C. rhomboidea (E), and P. radiata (F). Vertical dashed lines separate pre-drought unstressed ABA levels from levels following drought recovery.

