Fig. 4.
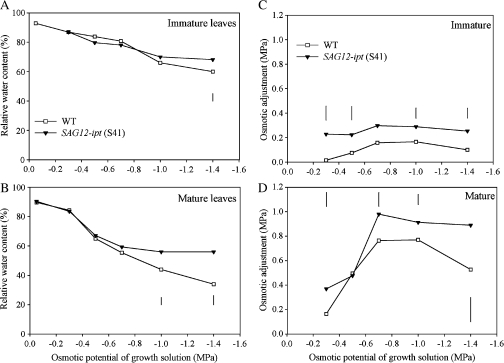
Relative water content (RWC, %) of (A) immature (top two leaves not fully expanded) and (B) mature (fully expanded) and osmotic adjustment (OA), calculated as the difference in osmotic potential at between fully rehydrated control and PEG-induced water stress treated leaves, of (C) immature (top two leaves not fully expanded) and (D) mature (fully expanded) leaves of SAG12-ipt creeping bentgrass (line S41) and wild-type ‘Penncross’ (WT) exposed to PEG-induced water stress at various growing solution osmotic potentials (–0.05 to –1.4 MPa). Vertical bars indicate LSD values where significant differences were detected (P ≤0.05) for comparison between plant lines at a given osmotic potential of the growth solution.

