
FIGURE 4.
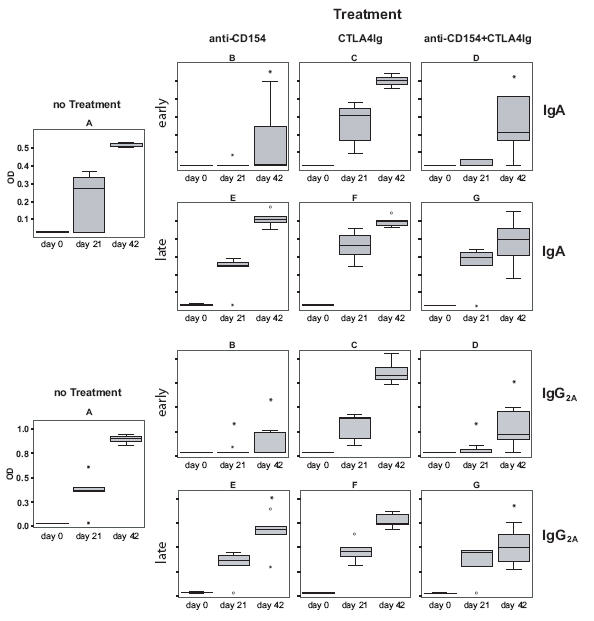
Effects of co-stimulation blockade on rPhl p 5-specific IgA and IgG2A antibody responses. Serum samples, collected at day 0, 21, and 42 from the mice of groups A-G were analyzed for Phl p 5-specific IgA and IgG2A antibodies by ELISA. Antibody levels (OD values) are displayed as box-and-whiskers plots, * indicates a significant reduction (p<0.05) compared to the untreated but sensitized group A.