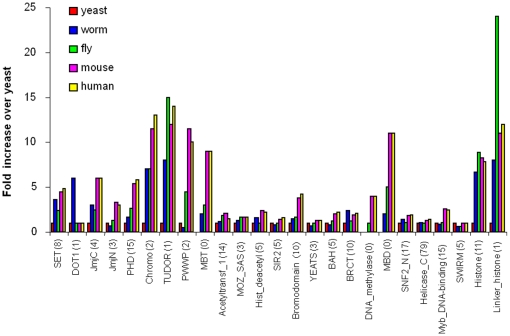
Figure 2. Expansion in the number of known CM domains in 4 model organisms relative to that in yeast.
On the X-axis, figures in parentheses following each domain denote the numbers of genes in yeast. Y-axis represents folds of increase over yeast when the number of domain-containing genes is non-zero in yeast, otherwise (for MBT, MBD and DNA_methylase domains), the absolute number of domain-containing genes in each organism.

