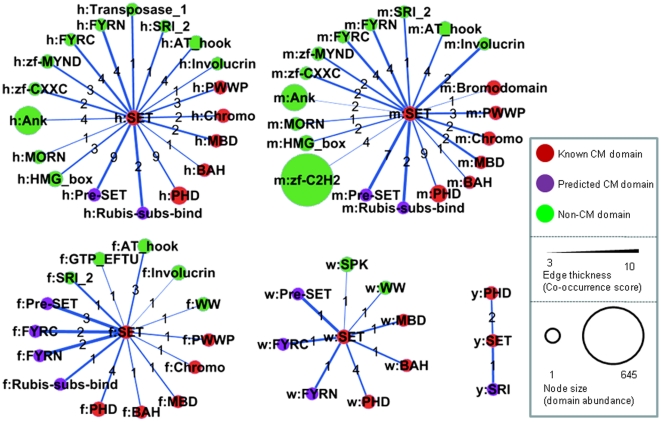
Figure 3. Abundance and combination partners of SET domains in yeast (y), worm (w), fly (f), mouse (m) and human (h) are shown as an illustration of domain neighborhood expansion as a function of domain abundance.
See Table 4 for SET domain abundance values in each organism. The prefix in front of each domain name indicates the source organism. Nodes represent domains and links represent co-occurrence relationship in a single protein. Size of the nodes is proportional to the number of domain-containing proteins in each genome, and nodes are colored red, magenta and green to denote known CM domains, candidate CM domains and non-CM domains, respectively. The figures on each edge indicate the numbers of proteins that contain the linked domain pairs. The thickness of edges is proportional to the Co-occurrence Score of the linked domain pairs (See Materials and Methods for definition of Co-occurrence Score).

