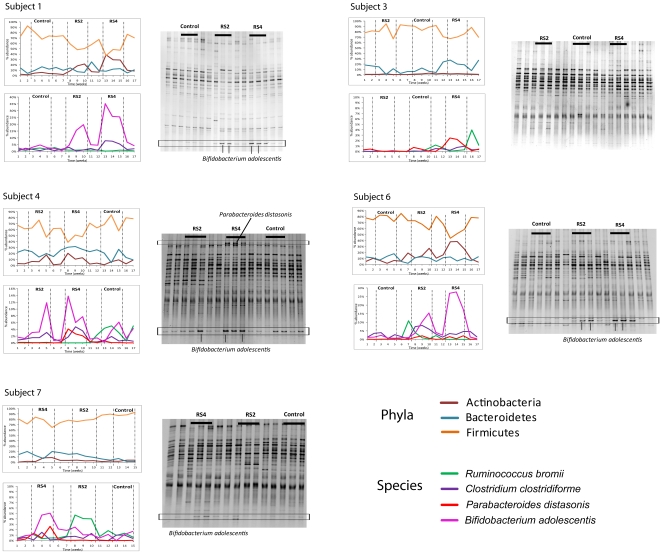
Figure 4. Temporal dynamics of the human fecal microbiota in response to the consumption of crackers containing RS2, RS4, and native wheat starch (control) in five human subjects.
Graphs on the left show proportions of the three main phyla and four representative species (Bifidobacterium adolescentis, Parabacteroides distasonis, Ruminococcus bromii and Clostridium clostridioforme) as determined by pyrosequencing of 16S rRNA tags. Gel images on the right show molecular fingerprints generated by DGGE. Bands that represent Bifidobacterium adolescentis and Parabacteroides distasonis are labeled.

