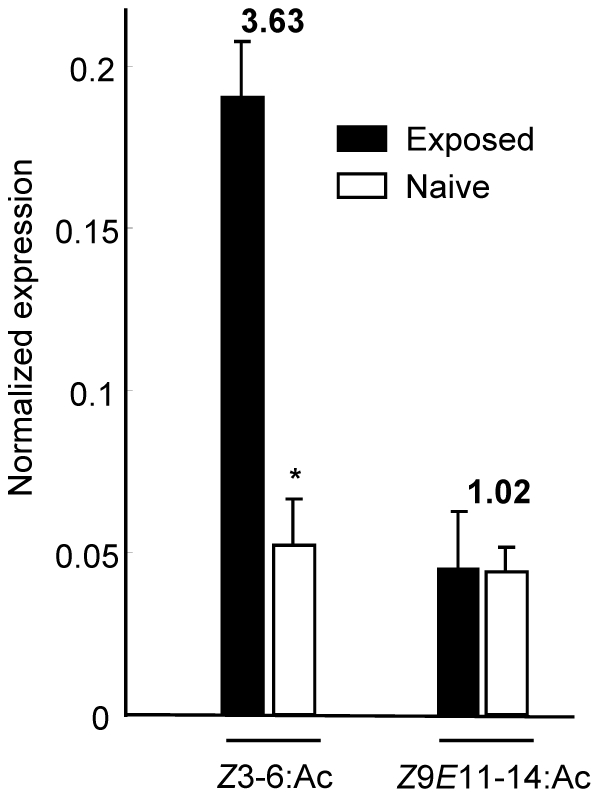
Figure 8. Quantitative analysis of SlCXE10 transcripts in male antennae after Z3-6:Ac and Z9E11-14:Ac exposition by qPCR.

The expression level of SlCXE10 was normalized to that of RpL13. Data were obtained from triplicate experiments and are given as the mean ±SD.
