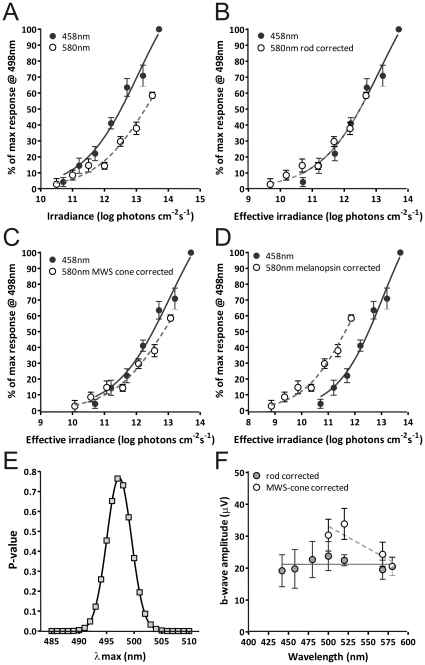
Figure 2. Spectral sensitivity of the TKO flash ERG.
A, ERG b-wave amplitude (mean±SEM; n = 7) from TKO mice (expressed as % of maximum response at 458 nm) for 458 nm (blue) and 580 nm (yellow) flash stimuli. B–D, The same data plotted with stimulus irradiance at the two wavelengths normalized according to the spectral sensitivity of rod opsin (B), MWS opsin (C), and melanopsin (D). F test statistic allows the use of a single curve for the two wavelengths (p>0.05) when normalised for rod opsin, but not for MWS opsin (p<0.01), or melanopsin (p<0.0001). E. The relationship between p for the F statistic and the λmax of the putative pigment used to normalize irradiance across the two wavelengths peaked close to 498 nm, the known spectral sensitivity of mouse rod opsin. F. b-wave amplitude (mean±SEM) for a range of monochromatic stimuli calculated to be isoluminant for rods (filled circles) or MWS-cones (open circles). Lines depict best fit by linear regression analysis, slope significantly different from 0 for the MWS-cone (p<0.05) but not rod (p>0.05) conditions. Note that the 580 nm datapoint contributes to both series.

