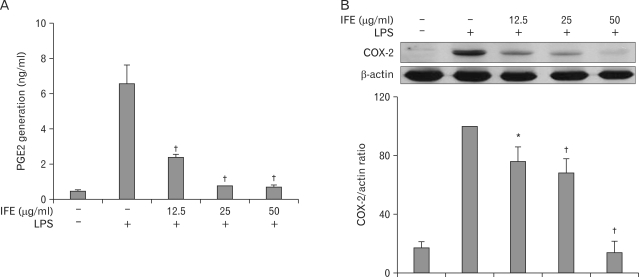
Figure 2.
Effect of IFE on PGE2 generation and COX-2 expression in LPS-treated RAW 264.7 cells. Cells were pretreated with different concentrations of IFE for 1 h and then stimulated with LPS (200 ng/ml) for 24 h. After incubation, the PGE2 levels in the cultured media were measured using an ELISA kit (A). Cells were harvested and equal amounts of cell extracts were subjected to Western blot analysis using antibody against COX-2. Quantification of band intensities from three independent results was determined by densitometric analysis. The values were expressed as a percentage of maximal band intensity in the LPS-treated cells, which was set to 100% (B). Values are expressed as the means±S.D. of three different samples. *p<0.01, †p<0.001, when compared with the control value.

