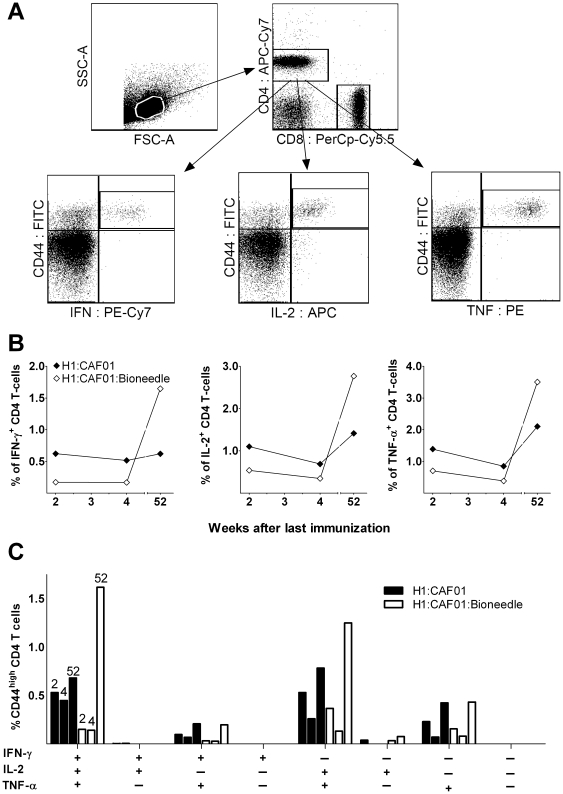
Figure 3. An icFACS analysis of cytokine expression in CD4 T cells in mice.
The cytokine expression pattern were measured upon restimulation of pooled PBMCs 2, 4 and 52 weeks after the last of three immunizations with 2 µg of H1 antigen combined with CAF01 (black) or combined with CAF01 and incorporated in Bioneedles (white). A) Gating tree for phenotypic and functional characterization of memory CD4 T cells in H1:CAF01-immunized mice by multiparameter flow cytometry. Lymphocytes were gated based on their forward scatter (FSC) vs side scatter SSC profile, and the CD4+CD44high. B) Intracellular IFN-γ, TNF-α, and IL-2 levels expressed as geometric MFI values were compared within the CD4+CD44high population. There were no significant difference between the MFI values obtained from the two vaccination groups. C) The cytokine-producing cells were divided into seven distinct subpopulations based on their production of these cytokines in any combination. The bar chart shows the frequency of each cytokine subset being CD44high out of the total CD4 T cell population. The bars within each subpopulation represent the two vaccination methods at week two, four and 52 after vaccination (exemplified in the triple positive subpopulation).

