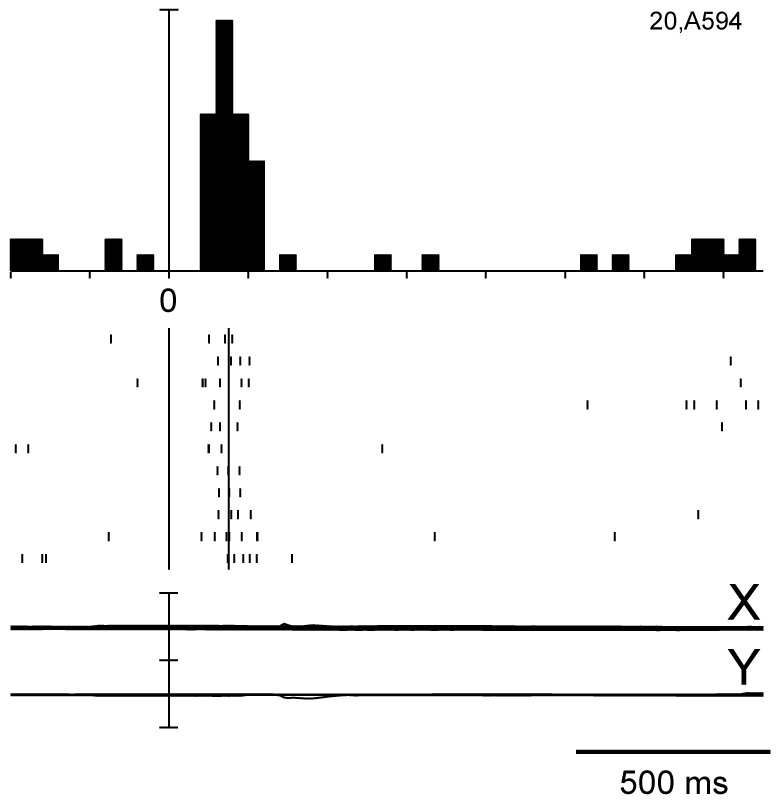
Figure 3. Typical visual response in V6A.

Neural activity and eye traces are aligned with cue onset. Peri-event time histograms: binwidth, 40 ms; scalebars, 38 spikes/s. Eyetraces: scalebar, 60°. Other details as in figures 1 and 2.The response started about 80 ms after the cue onset. The cell showed a brisk response whose duration was similar to the duration of the stimulus (150 ms).
