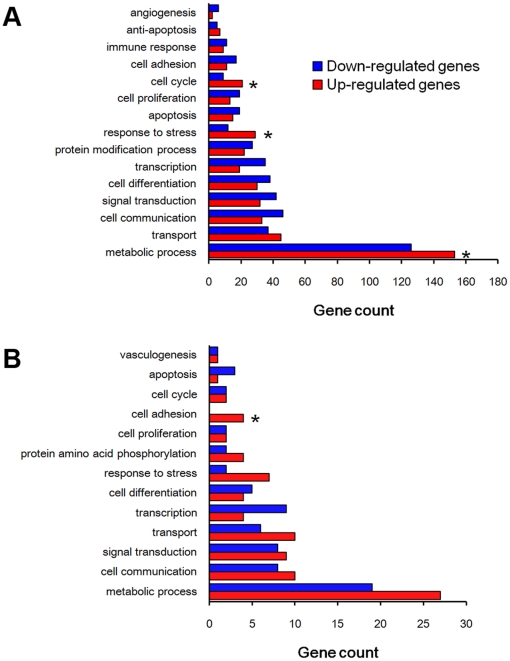
Figure 7. Gene Ontology analysis.
(A) The differentially expressed genes from SAGE-Illumina sequencing data. (B) The coherent target genes of the differentially expressed miRNAs. Gene ontology analysis is performed with DAVID tools (http://david.abcc.ncifcrf.gov/tools.jsp). The enrichment p-values are corrected by Benjamini's methods.

